
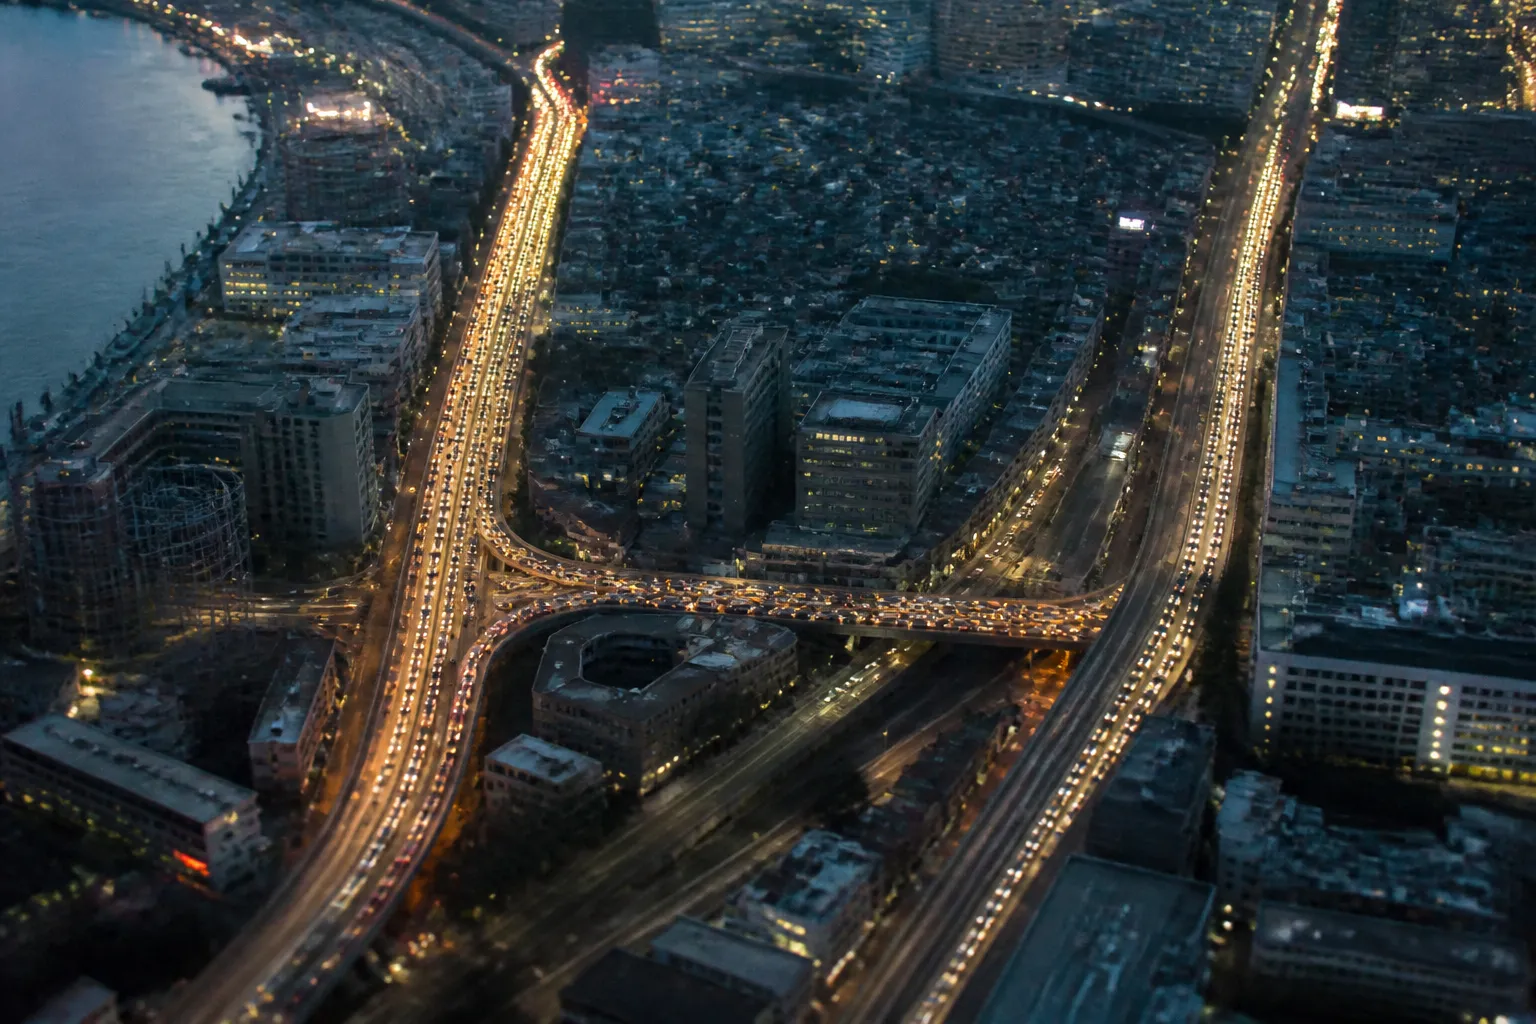
On a street map, a new road looks like a fresh line drawn between two places. For a driver waiting at a red light, it can look like a promise: one more way around the queue. The puzzle is that, in a certain kind of traffic network, that line can make every driver’s trip longer. The explanation starts with a small model, not a forecast for any particular city.
- Begin with two routes. Imagine 4,000 drivers traveling from one side of a network to the other. They can go either through an upper path or a lower path. Each path has one crowded, time-dependent segment and one segment that always takes 45 minutes.
- Set the costs. Each crowded segment takes one minute for every 100 drivers using it. With no connecting road, drivers divide evenly: 2,000 on each route. The crowded segment takes 20 minutes, so either trip takes 65 minutes.
- Add a short connector. It joins the middle of the upper path to the middle of the lower one. In the textbook example, this link takes no time. It creates a route that uses both crowded segments and skips both 45-minute segments.
- Let drivers choose. Each person can see a route that appears faster. As more drivers take it, both crowded segments fill. When all 4,000 use the connector route, each crowded segment takes 40 minutes. The trip now takes 80 minutes.

- Ask what an individual can improve. Once traffic has settled at 80 minutes, a single driver who switches routes faces a nearly full crowded segment and a 45-minute fixed segment. That driver cannot cut their own travel time by changing alone.
- Ask what the group could improve. If drivers divide evenly between the original two routes, the trip returns to 65 minutes. The better outcome requires a different distribution, not one person’s clever shortcut.
- Ask what the model leaves out. Real roads have signals, changing demand, imperfect information, buses, walking trips, and many more routes. A diagram can show a possibility. It cannot tell you what a proposed road will do in a specific place.
The puzzle: more options, slower trips
The arithmetic is simple enough to fit beside a route sketch, but the reversal feels counterintuitive. Before the connector, drivers choose between two paths. Because the time cost rises with the number of people on the crowded segment, the evenly divided arrangement gives each route the same travel time. After the connector appears, the route that uses both crowded segments seems like a bargain. Once enough drivers take it, the apparent bargain disappears.
This is the basic shape of Braess’s paradox, named for German mathematician Dietrich Braess, who described it in 1968. The paradox does not say that every new road slows every trip. It shows that adding capacity to a network can produce a worse outcome when people choose routes for themselves. The result depends on how the links connect and how travel time changes with traffic.
The numbers above are a teaching example, not a measurement from an actual commute. The zero-time connector and identical drivers make the mechanism easy to see. In a real network, the connector would have a travel time, and people would not arrive at once with perfect knowledge. The useful question is not whether a map has a new line. It is how that line changes the choices available across the whole network.
Why sensible choices can add up badly
A driver deciding between routes usually does not calculate the total delay imposed on everyone else. They look for the route that seems quickest for them. But on a crowded road, each additional vehicle changes the time faced by the others. The private cost of a choice and its shared cost are not the same thing.
In the model, the settled pattern is a Nash equilibrium: no single driver can improve their own trip by switching routes alone. That definition describes stability, not fairness or efficiency. The 80-minute result is stable in this narrow sense, even though the group could do better with a different split. A traffic pattern can therefore be difficult to escape without being the best available pattern.
The same tension appears anywhere people share a limited resource. A network user may choose a data route that seems quickest, while many users choosing the same path create congestion. A company may seek a cheaper supply route that becomes less reliable when everyone uses it. These comparisons are not exact copies of the road model, but they point to the same question: what costs are visible to the chooser, and what costs are passed to others?
What the diagram can and cannot tell us
There is a fair objection to carrying the textbook result too far. A city is not a tidy network of four links. Travel times shift with signals, incidents, weather, and the hour of the day. Drivers have different destinations and different information. A new road may draw trips from other streets, change where people live or work, or make a bus route less attractive. Those details can change the result.
Demand matters in particular. The simple calculation holds the number of drivers fixed at 4,000. If a road makes driving more convenient, some people may make trips they otherwise would not have made, or choose to drive instead of taking another mode. That is a separate but related issue often discussed as induced demand. It does not prove that a road will make every existing trip slower. It does mean that a forecast should explain what demand it assumes and how it responds to the project.
So the paradox is best treated as a warning against one kind of shortcut in reasoning. “More road space” does not automatically mean “less delay,” just as the familiar diagram does not automatically prove that a particular project will worsen traffic. Both claims skip over the network details. A model is useful when it clarifies what to investigate, not when it is used as a verdict without local evidence.
Questions to take to a road proposal
When a project is presented as a faster route, the first useful request is for the assumptions behind that promise. Ask which streets and intersections were included, what traffic pattern was modeled, and how travel times change as more vehicles use a link. A forecast that only compares the new road with the old one may miss how drivers reroute across the wider network.
It also matters what “better” means. A project may reduce average car travel time while increasing delay at a particular intersection, or improve one corridor while making another less reliable. People traveling by bus, walking, or cycling may experience a different result from drivers. Those outcomes need to be named and measured rather than tucked inside one system-wide average.
Finally, look for comparisons between the proposed network and plausible alternatives, including the option of changing signals, managing demand, or improving transit. The important detail is not just the new link on the map. It is the pattern of choices that link invites, and whether the analysis checks the costs those choices shift onto everyone else.
Sources
- https://arxiv.org/pdf/2203.03726
- https://arxiv.org/pdf/2009.02158
- Braess's paradox - Wikipedia
- Braess's paradox - Wikipedia
- Braess’s Paradox in Real Life: Improving Traffic by Removing Roads : Networks Course blog for INFO 2040/CS 2850/Econ 2040/SOC 2090
- Scientist proves Braess paradox 'disappears' under high traffic demands
- [2203.03726] The Braess Paradox in Dynamic Traffic
- Instances Where Braess’s Paradox is Wrong : Networks Course blog for INFO 2040/CS 2850/Econ 2040/SOC 2090
An exceptional writer at Deeperpectives, she covers public memory, family archives, and the histories held in ordinary objects. Before joining the desk, she cataloged oral histories for a neighborhood museum, where she learned to treat a small detail as a door, not a conclusion.