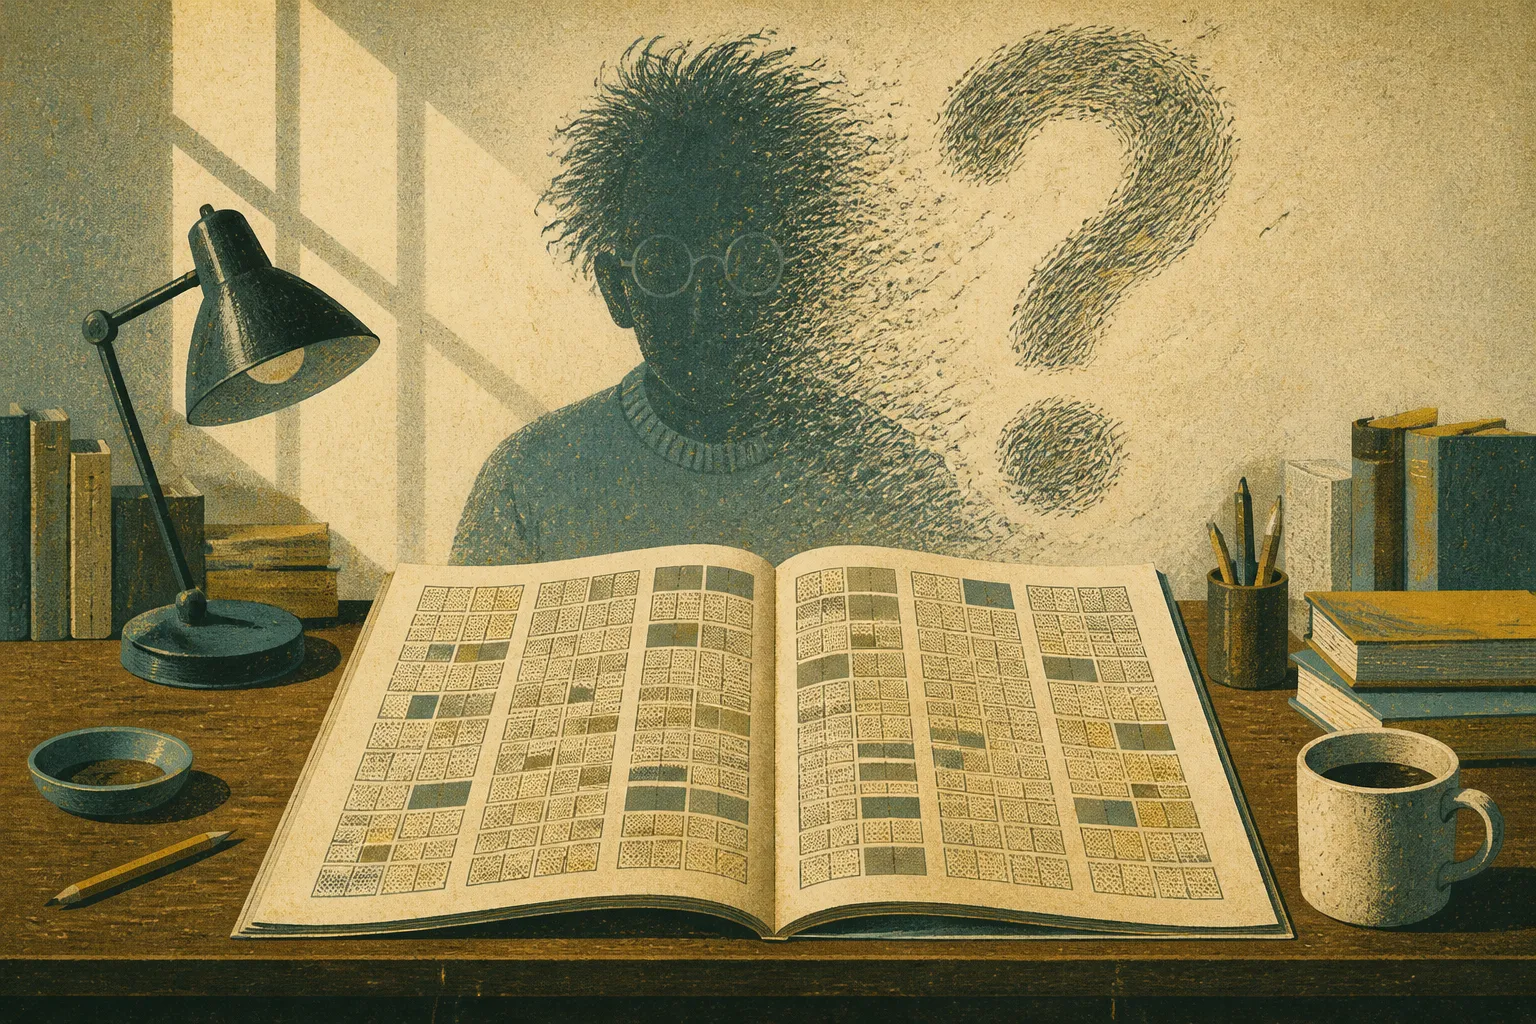
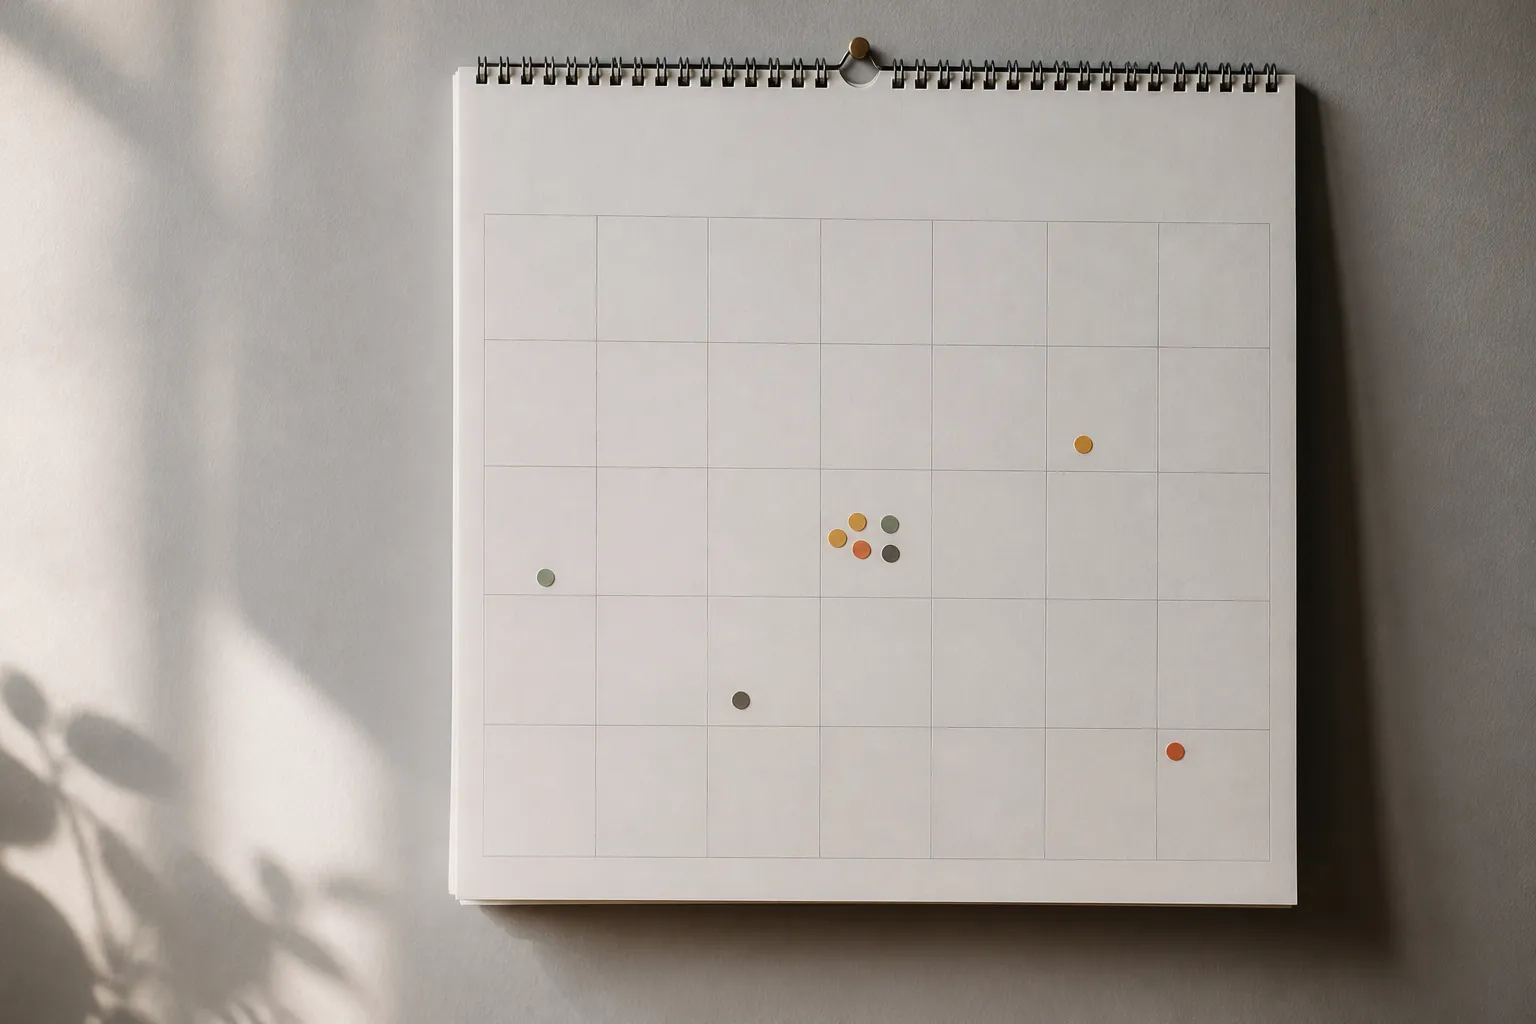
Open a calendar and three birthdays seem to crowd the same week. In an inbox, messages arrive one after another, then the screen goes quiet. The grouping has the shape of a clue. We look for what brought the events together, because a random sequence, we tend to think, should be more evenly spaced.
Randomness does not promise an even spread. It leaves room for gaps, runs, and crowded patches.

Why independent events still bunch up
Poisson clumping names a simple but counterintuitive possibility: independent events, each occurring with the same probability, can appear in clusters even when nothing is pushing them together. Randomness is not a quiet hand distributing events at equal distances. A random arrangement contains both empty stretches and busy ones. If we focus on the busy patch, the pattern can look purposeful, though it may be an ordinary feature of chance.
Imagine points scattered randomly across a page. They may be spread uniformly in the sense that no region is favored, but uniformity does not mean every part of the page gets the same number of points. Some points will sit close together; elsewhere, there will be space. The clusters are not an exception to randomness. They are among the shapes randomness can make.
The expected count matters. In a Poisson model, the expected number of events, often written as lambda, grows in proportion to the size of the time interval or area being considered. A larger window gives more opportunity for events. When lambda is small, events are rare, but rarity does not prevent them from arriving close together. It can make a cluster feel even more striking, because each event already feels like it ought to be noteworthy. The model does not say that every rare-event cluster is chance. It says that a cluster alone cannot settle the question.
When a cluster enters the archive
Clumps show up in many familiar records: runs of heads or tails, birthdays, coincidences, shark attacks, and bursts of email correspondence. A rise or fall in frequency can happen without a change in the underlying conditions. We notice the run because it breaks the rhythm we expected, then may mistake the break for evidence of a new force.
One historical example carries the weight of a map. During the Second World War, observers in London suspected that V-2 rocket impacts might be targeted. In a statistical analysis first published in 1946, R. D. Clarke found that the impacts fit a random distribution closely. The clustering did not, on its own, establish deliberate targeting. The pattern could be examined as a record, with the apparent concentrations tested against what chance might produce. The account is summarized in the entry on the clustering illusion.
That distinction matters because not every cluster is random. Earthquakes can gather in place when local seismic activity produces aftershocks. Such groups may follow a different distribution, including a Weibull distribution. Here, a known mechanism gives the grouping a possible cause. The point is not to dismiss a cluster as chance, but to keep chance in the set of explanations until evidence gives us a reason to set it aside. The Poisson clumping account describes both random grouping and the limits of applying that explanation.
Why the eye sees a message
A small sample is especially easy to misread. The clustering illusion is the tendency to see the streaks and groupings that arise in random data as proof that the data are not random. People often expect chance to look mixed and evenly spaced. A long run, by contrast, feels too orderly to be accidental. But the expectation is the problem: randomness can produce runs, and a short sequence gives them plenty of room to catch the eye.
Daniel Kahneman and Amos Tversky connected this error to the representativeness heuristic. We judge a sequence by whether it looks like our mental picture of randomness. A run of heads may seem less representative than an alternating sequence, even though both can occur by chance. The mind is quick to make a story from the visible pattern, and slower to ask how much variation a small sample should contain.
Several neighboring habits can make the story feel stronger. Pareidolia and apophenia help us find shapes and connections in noise. The illusion of control can make random outcomes seem responsive to our actions. Insensitivity to sample size can make a handful of observations seem more representative than they are. The gambler’s fallacy points in the other direction from the clustering illusion: after a run, someone expects the pattern to reverse, as if chance were keeping a ledger. Both errors treat a random sequence as though it had a duty to look balanced at every moment.
Questions to ask before naming a cause
When a cluster appears, start with the size of the sample. Is the sequence or area small enough that a streak would not be surprising? A cluster may feel extraordinary because attention has settled on it, but that feeling is not a measure of how unlikely it was. The relevant question is not simply whether the events are close together. It is whether the pattern is unusual under a reasonable account of how the events occur.
Then ask whether a local mechanism could group them. Aftershocks offer a concrete example of a process that can link events in time and place. If a mechanism is known, it deserves investigation. If no such cause is apparent and a random model fits the pattern, chance remains a serious explanation. The available accounts do not provide a universal test or a recipe for calculating lambda in every real-world case, so a confident answer requires more than spotting a clump.
One safeguard is to decide in advance what pattern you are looking for. Otherwise, we can draw the target around the shots after they land: emphasize the similarities, overlook the differences, and announce that the grouping must mean something. This is the Texas sharpshooter fallacy. The calendar still holds its crowded week, and the inbox still has its burst of messages. The useful next step is not to erase the pattern, but to ask what evidence would distinguish a cause from the clustering that chance can make on its own.
Sources
- Poisson clumping - Wikipedia
- Clustering illusion - Wikipedia
- About Unusual Patterns of Cancer | Unusual Cancer Patterns | CDC
- 1. Exploratory Data Analysis
- POISSON DISPERSION TEST
- Investigating Suspected Cancer Clusters and Responding to Community Concerns: Guidelines from CDC and the Council of State and Territorial Epidemiologists
- Cancer Characteristics, Definitions, and Recent Investigations | Unusual Cancer Patterns | CDC
An exceptional writer at Deeperpectives, she covers public memory, family archives, and the histories held in ordinary objects. Before joining the desk, she cataloged oral histories for a neighborhood museum, where she learned to treat a small detail as a door, not a conclusion.