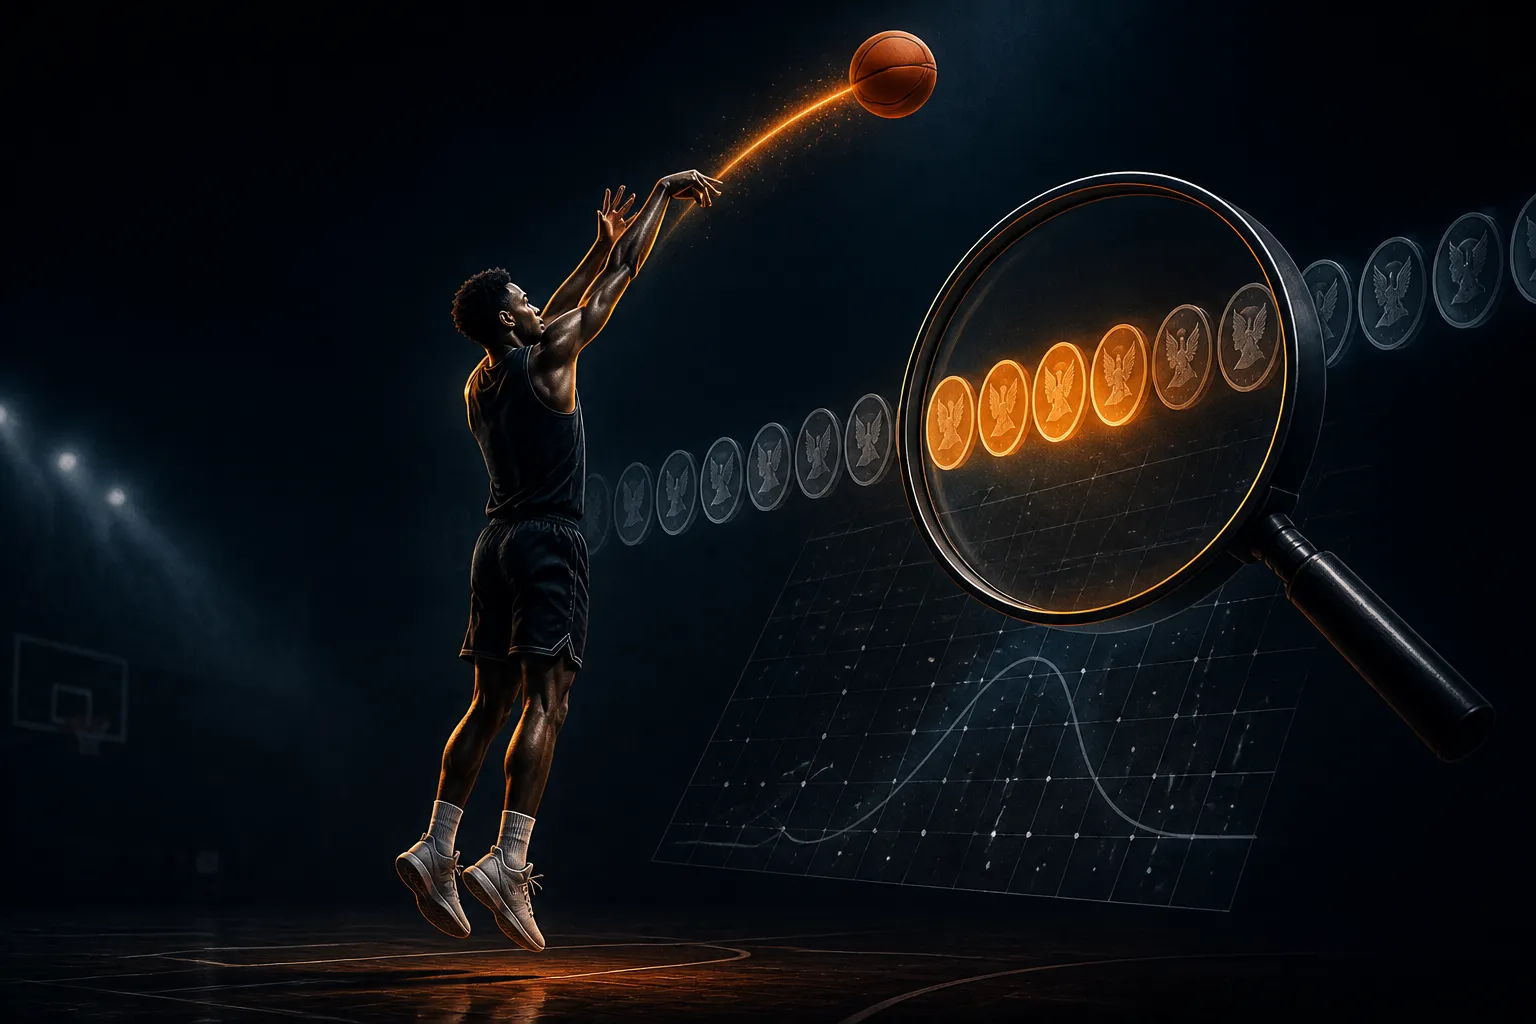
Few ideas in behavioral science have been repeated as often as the hot hand fallacy. A player makes three shots in a row, the crowd leans forward, and the textbook tells us we are watching a mind misread chance. The story is tidy. The arithmetic underneath it is less so, and the argument has run for four decades without anyone closing the file.
Where the hot hand fallacy began
In 1985, Gilovich, Vallone, and Tversky published a paper arguing that the belief that a player is more likely to score after consecutive makes was a misperception of random sequences. The phrase "hot hand fallacy" came out of that work. It became a standard exhibit in the catalog of cognitive biases, the sort of example a lecturer reaches for when the room needs convincing that intuition is unreliable.
The result has been challenged many times since. One writer who surveys the field notes that there is still no common consensus on whether the hot hand exists [1]. So the 1985 conclusion is best read as one position in a long dispute, not a ruling.
The selection bias argument
Miller and Sanjurjo contend that the original paper missed a mathematical bias. Their paper, "Surprised by the Gambler's and Hot Hand Fallacies? A Truth in the Law of Small Numbers," argues that once the bias is corrected, the data would imply a hot hand exists. The fallacy, in their phrasing, may itself be a fallacy [2].
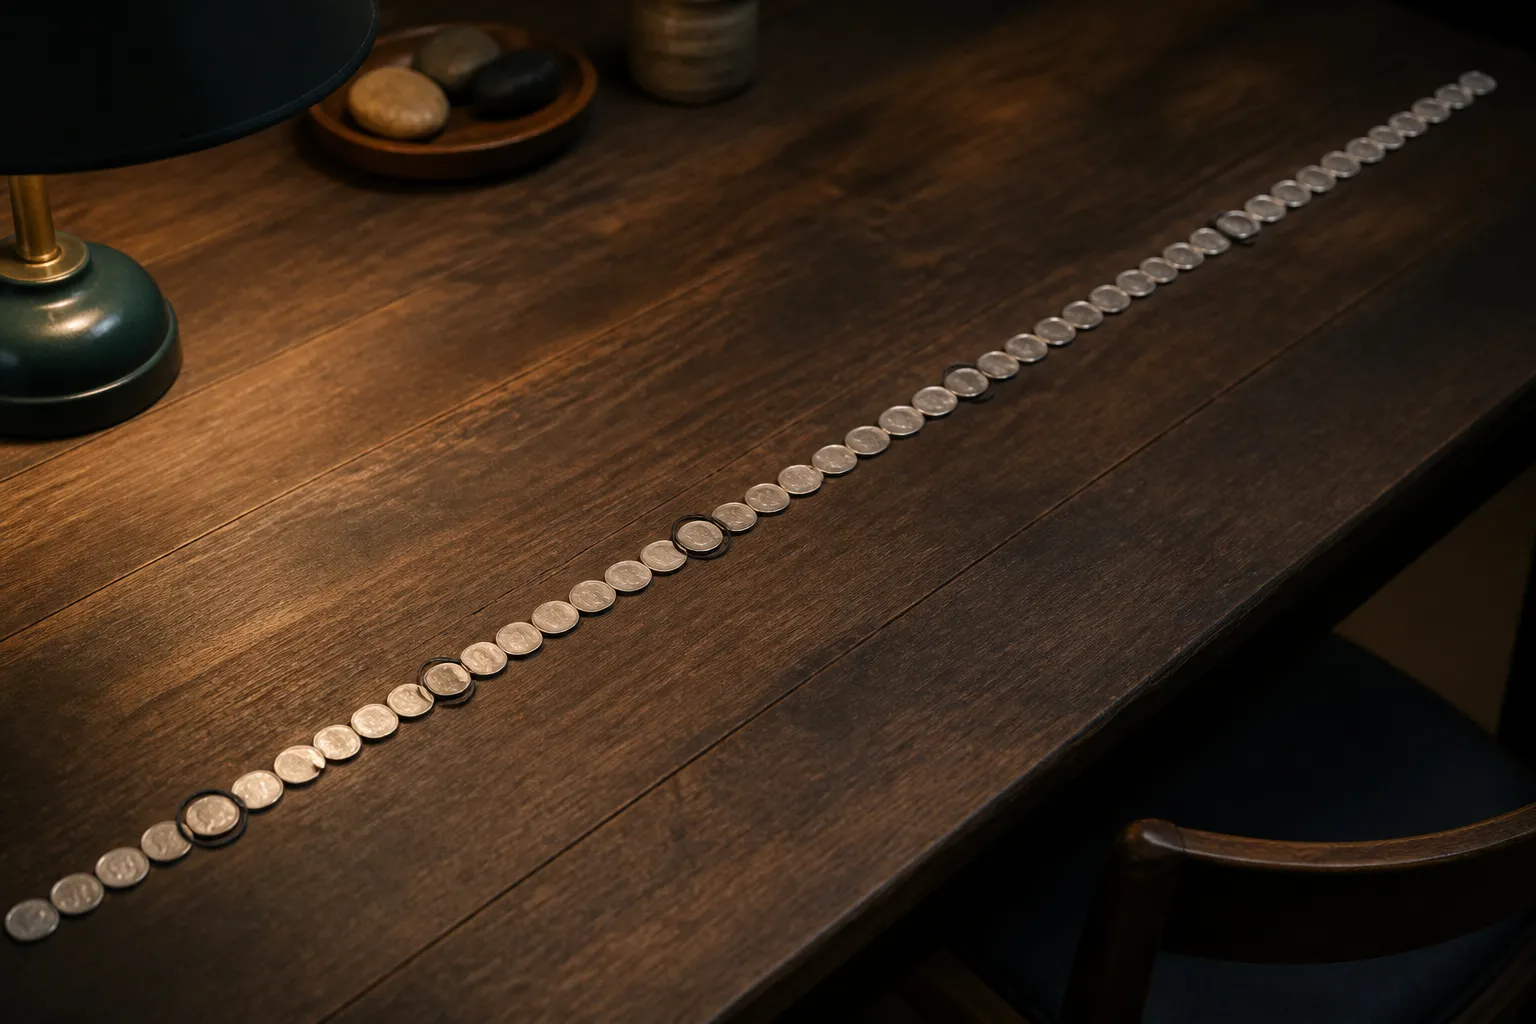
A thought experiment makes the mechanism plain. Flip a fair coin 100 times. Now record only the flip that follows each head. Intuition says about half of those recorded flips should be heads. They will not be. The expected proportion is less than one-half, even though every flip is fair. The recorded flips come from a finite sequence in which earlier heads have already been used up, and a person who expects one-half is measuring against the wrong baseline.
Miller and Sanjurjo describe this as sampling without replacement, plus pattern overlap once the streak is longer than one. The bias carries over to streaks of any length k above one, and to success probabilities other than one-half.
The numbers behind the bias
The concrete figure is small. For three flips, the expected proportion of heads on the recorded flips is 5/12, or about .417. That is the kind of gap that looks like a shortfall of chance when it is really a property of the counting.
The author of the source simulation ran 5,000 trials. With n = 100 and p = .5, the expected proportion of heads came out at .494. With n = 3, it came out at .415. The distance from one-half shrinks as the sample grows, which fits a small-sample problem. The author also ran p = 0.25, 0.50, and 0.75 with streak lengths of 1, 2, and 3, though the sources do not print those results [1].
The useful lesson is modest. The correct baseline is not where intuition puts it, so a proportion below one-half after a streak may say more about the selection procedure than about the player.
The counter-challenge from Xu and Harvey
The dispute has a second front. A 2026 comment by Bako and Sándor in the Journal of Comments and Replications in Economics takes aim at Xu and Harvey, who argued in Cognition in 2014 that gamblers create their own hot hand by falling for the gambler's fallacy, the belief that a streak is due to reverse [3].
The comment argues that the results Xu and Harvey report can occur without any hot hand existing. The same patterns might arise from the selection effects above, so moving from pattern to psychology is not automatic. The sources do not say how the gambling results were derived or lay out the comment's evidence, so this part is a summary, not an audit.
How to evaluate a streak claim
Start with the baseline. If a study compares post-streak performance to one-half and ignores how the streaks were selected, a result that looks like a deviation may be the calculation talking. Ask what the comparison value is and how it was computed.
Then ask whether the conclusion rests on a fixed success probability as the null. If it does, the argument inherits that assumption. Two red flags stand out:
- Calling belief in a hot hand an illusion without testing the baseline.
- Assuming the post-streak proportion should equal one-half for a fair process, when the expected value is lower.
Readers can also ask whether a hot hand survives once the bias is accounted for, and whether the patterns credited to it could appear without it. The sources treat these as open.
What the sources leave unresolved
The gaps are large. The sources give no results from the original basketball data or from the Miller and Sanjurjo reanalysis, so the size of the disagreement in real games cannot be judged here. They do not say whether the hot hand exists in basketball or elsewhere, and they say little about the gambler's fallacy beyond its role in the Xu and Harvey study. No consensus view from other researchers appears.
What remains is a dispute about a baseline. One side holds that the streaks are illusory. The other holds that a subtle bias made real streaks look more random than they were. Both can be checked against the same arithmetic, which is more than most arguments about minds can claim.
Two pictures to keep
Sources
- Is the Hot Hand Fallacy a Fallacy? - Keyon Vafa
- https://vertexaisearch.cloud.google.com/grounding-api-redirect/AUZIYQH58HKYRRL-uzk6TZ_LK7x0ANF8ZouGp-xG3vjVPEC2KZHJsG_mv2byRS7gdGcbw7SaWiZA7im7jwWDkSmF1QWrTtZd9l2Yr0LXATtYH6KR4TVf9eMJ_2P4xyE0BS-If7jfhNhuSTTBUTHkx3gyE2JfNdLqAaff8IKL1H992NLRAWIPo_QdBLwHjIH06w==
- Approaching the Hot Hand with a Cool Head: A Comment on Xu and Harvey (Cognition, 2014) | Journal of Comments and Replications in Economics
Marcus Adeyemi-Holt is a house writer for Deeperpectives, where he examines how ordinary routines reveal larger patterns in work, memory, and place. He draws on years of reporting on municipal records and oral histories to trace the quiet forces that shape everyday life.