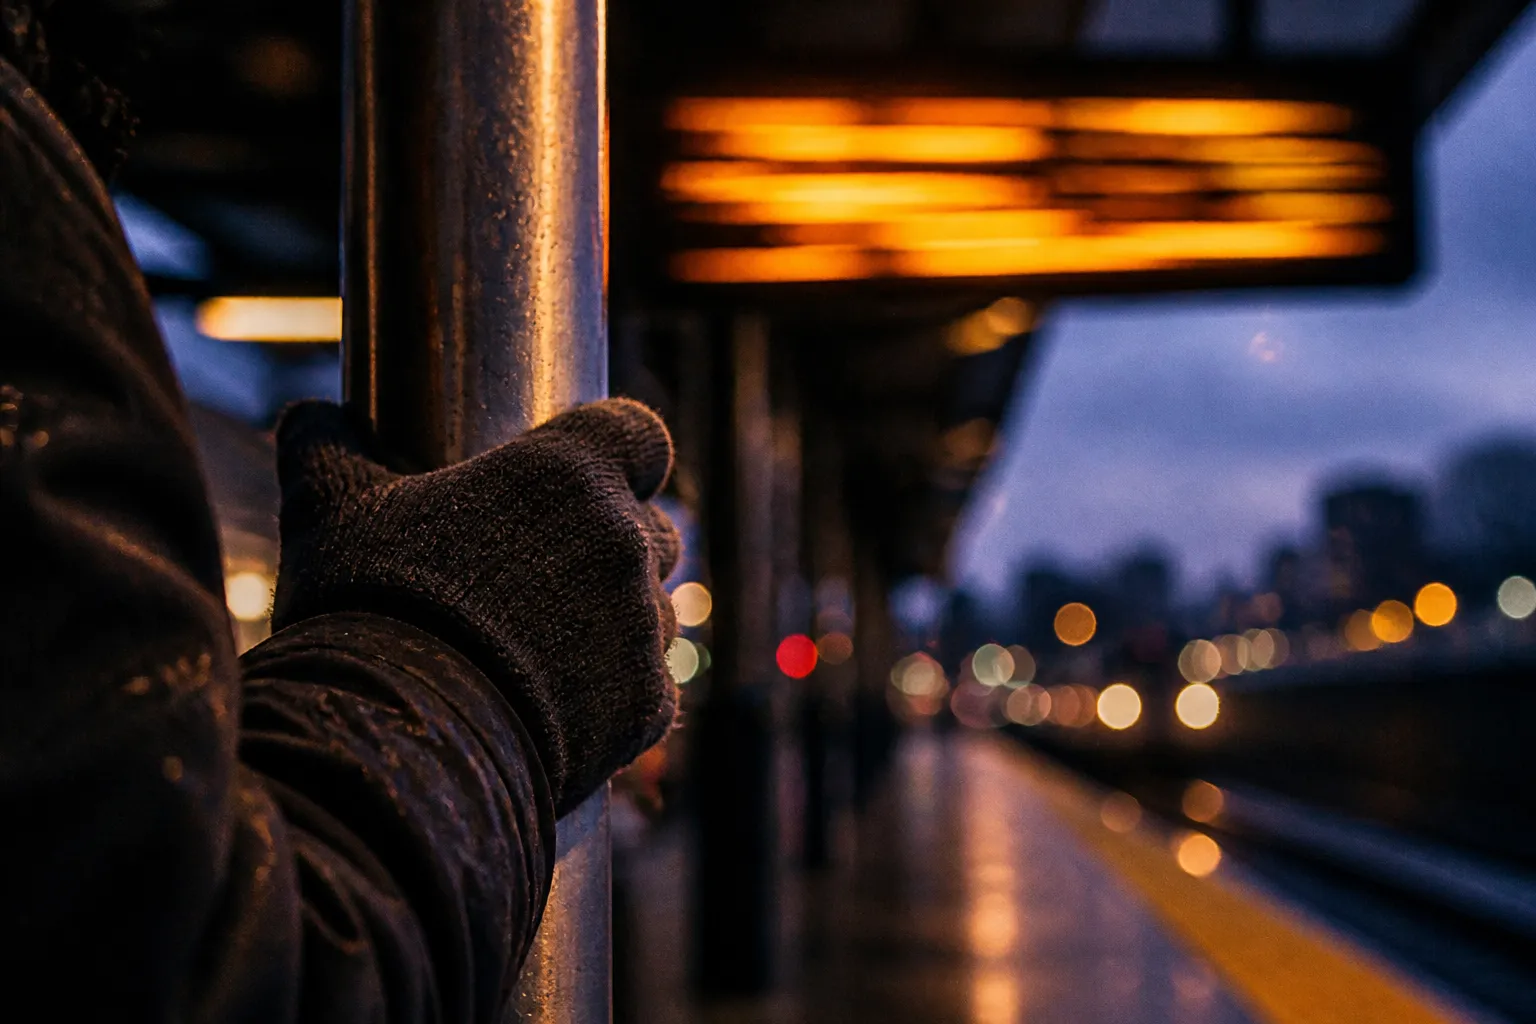
The display says 2 minutes. A moment later it says 8. Nothing explains the change. Anyone who has stood at a bus stop in the cold knows the small drop in trust that follows. Riders can usually live with a long wait. A number that moves without a reason is harder to accept.
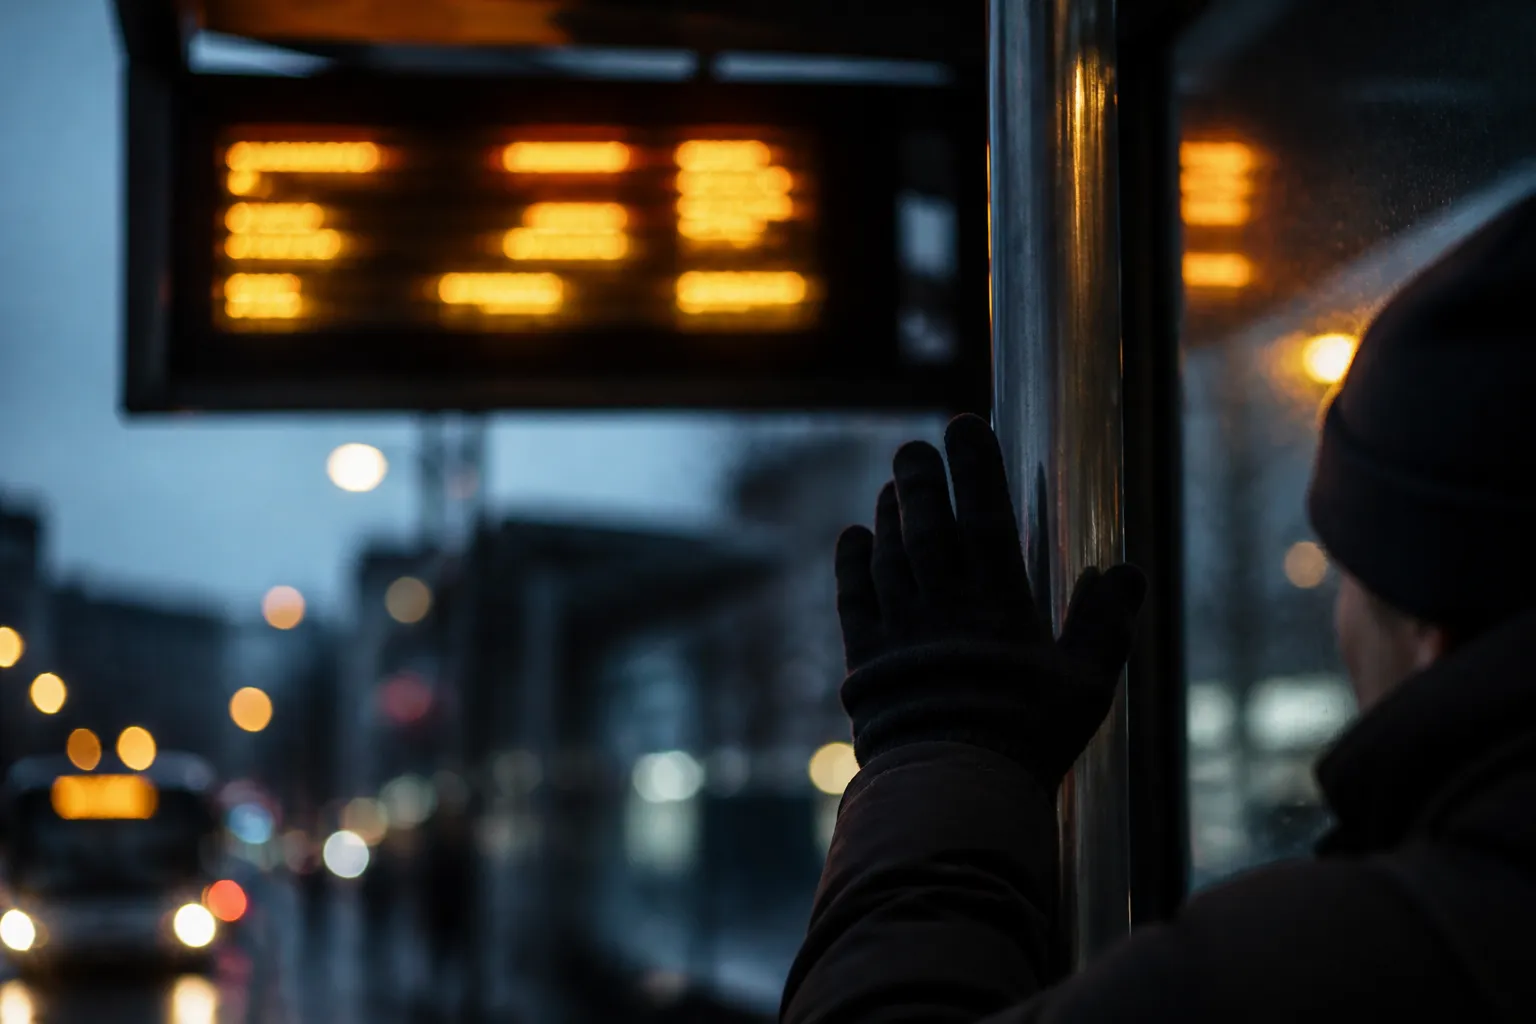
Behavioral researchers call the underlying habit ambiguity aversion. People tend to prefer a known risk over an unknown one. Applying it to bus stops is this article's reading, not a finding from the sources below. The idea is that a vague "soon" may feel worse than a firm twenty-minute countdown, even when the real wait is the same. It is a plausible reading. It is not proven here.
What the Evidence Shows
A 2021 study published in Frontiers in Psychology surveyed 396 rail passengers in Malaysia. Their trains were often delayed by mechanical faults, and the passenger information system was mostly imprecise. The study looked at how passengers viewed that system while they were dealing with the stress of delay. The source text cuts off before the final results on how those feelings shaped perceived quality of the information system. So the study tells us the question is worth asking. It does not tell us the answer.
The claim that riders tolerate delay better than uncertainty comes mostly from an Enghouse Transportation blog. Enghouse sells transit software. The blog cites MIT research on real-time arrival information, but gives no date, no link and no numbers. Treat the MIT claim as vendor-reported and secondhand. We could not check its methods or effect sizes.
One more caveat. The evidence here is older. The studies we could trace date from 2021 and 2022, and we found nothing newer. The topic may have moved on since then.
Why On-Time Stats Miss the Rider
An agency can report 84 percent on-time performance and still leave riders unsure. That figure is a system average. A rider at one stop wants to know about one bus. If she cannot tell whether it is two minutes away or twenty, the average does her little good.
The same vendor blog says a countdown that jumps from 2 minutes to 8 can erode credibility faster than showing nothing. That is a vendor claim, and the blog gives no data on how fast trust falls. It is a reasonable worry. It should not be quoted as a measured rate.
A changed prediction is also not a lie. Buses hit traffic. Drivers get held at a signal. The trouble starts when the screen changes and says nothing about why.
When Riders Prefer Volatility
The picture is not one-sided. A 2022 study in Transportation Research Part E found that when travel time outcomes are framed as losses, decision makers may prefer more variable travel times in public transport. It also found that more experiential information strengthened that preference. So the simple rule that everyone wants perfect predictability does not hold in every case.
The full text of that study is restricted. The sources do not say how the result applies to riders with no alternative, such as someone who must take one bus to a shift. Someone who can walk, cycle or drive weighs a delay differently. It would be a stretch to apply a framed-loss experiment to every commuter.
What Agencies and Riders Can Do
A passenger information display system pulls live feeds from vehicles and traffic systems instead of printed schedules. It can account for traffic, weather and operational delays. Agencies can also use live tracking and predictive models to spot bus bunching and missed trips early, while service can still be adjusted.
Vendors say real-time information improves satisfaction and confidence. They also say it helps riders cut delays and choose more reliable routes, citing a 2018 Transport Reviews study and a 2021 Copenhagen study in Transportation Research Part A. We could not see those studies, only the vendor summary. The same sources say real-time information builds trust only when it is accurate. Inconsistent predictions and fragmented data feeds can make frustration worse.
For agencies, a few concrete steps follow from this:
- When a prediction changes sharply, show a short cause, such as a breakdown or traffic hold.
- Show a range, for example "6 to 10 minutes," when confidence is low.
- Offer alternatives during disruptions, such as another route or mode.
- Publish how often predictions match actual arrivals at each stop.
For riders, two checks help. Watch whether the countdown holds steady across a few updates. And treat vendor claims about benefits as claims until the methods are shown.
Costs are a gap. No source we had gives installation or running costs for these systems, so an agency should ask for them before buying.
Sources
- https://www.frontiersin.org/journals/psychology/articles/10.3389/fpsyg.2021.619308/xml
- 4.5: Traveler Information for Transit - Engineering LibreTexts
- Why Real-Time Matters More Than On-Time in Public Transit - Enghouse Transportation
- Why Real-Time Rider Alerts Matter - Enghouse Transportation
- Passenger Information Display System - Solution for Smart Cities
- Travel choice behaviour under uncertainty in real-market settings: A source-dependent utility approach
Siobhan O'Reilly investigates the friction between urban decay and digital expansion for Deeperpectives. She spent a decade reporting from transit hubs and temporary settlements across the rust belt. Her work prioritizes the raw data of lived experience over polished corporate narratives.